| Journal of Clinical Question. 2025; 2(6): e99 https://doi.org/10.69854/jcq.2025.0042 Advance access publication date 28 December 2025 |
 |
Original Research
Associations of Waist Circumference and Body Mass Index with the Prevalence Lifestyle-Related Diseases in an Aging Asian Population
Da Li1,#, Yang Xiang2,#, Guang-Qiang Lai 3, Sinead Sheridan4,5,*
1Department of Internal Medicine, Hangzhou Linping District Hospital of Integrated Traditional Chinese and Western Medicine, Hangzhou, China.
2Department of Endocrinology, The First Affiliated Hospital, Zhejiang University School of Medicine, Hangzhou, China.
3Patient Services Department, The Chinese University of Hong Kong Shenzhen Medical Centre, Shenzhen, China.
4Department of Sports Science and Physical Education, The Chinese University of Hong Kong, Hong Kong, China.
5Tokyo IMG Clinic, 8F, SVAX Daimon Building, 2-1-20 Hamamatsucho, Minato-ku, Tokyo, Japan.
#Co-first author
*Corresponding Author: e-mail: sineadsheridan@cuhk.edu.hk
Submitted: November 15, 2025 Accepted: December 27, 2025
Clinical Question Box
In Chinese adults aged ≥60 years, is waist circumference or body mass index more strongly associated with lifestyle-related diseases?
Both waist circumference and body mass index are positively associated with the prevalence of lifestyle-related diseases. However, waist circumference shows a slightly stronger association with lifestyle-related diseases than body mass index among older Chinese adults. Optimal cut-off values of 87 cm for men and 81 cm for women demonstrate the strongest associations with lifestyle-related diseases.
Abstract
Introduction: Lifestyle-related diseases (LRDs), including hypertension, dyslipidemia, and type 2 diabetes mellitus (T2DM), impose substantial public health burdens, particularly in aging Asian populations who may develop metabolic abnormalities at relatively lower levels of adiposity. Although waist circumference (WC) and body mass index (BMI) are widely used anthropometric indicators, their optimal thresholds and strength of association with LRDs remain uncertain among older Chinese adults. Methods: A retrospective observational analysis was conducted in adults aged ≥60 years who underwent routine health examinations at a community hospital in Southeast China between April 2021 and December 2023. Associations between WC, BMI, and LRDs were examined, and receiver operating characteristic analyses were performed to assess discriminatory accuracy and to identify sex-specific cut-off values. Results: Among the 63,528 included participants, the prevalence of T2DM, dyslipidemia, hypertension, and overall LRDs was 27.4%, 39.2%, 69.2%, and 83.5%, respectively. Both WC and BMI demonstrated strong dose–response relationships with all LRDs. WC yielded area-under-the-curve (AUC) values of 0.673 in all individuals (optimal cut-off 83 cm), 0.660 in men (87 cm), and 0.674 in women (81 cm). BMI showed AUCs of 0.650, 0.652, and 0.649, with corresponding cut-offs of 24.0, 24.1, and 23.8 kg/m2 for any LRD. Although the predictive performance for individual diseases was modest, all associations were statistically significant (p < 0.001). Conclusions: Higher WC and BMI are significantly associated with increased prevalence of hypertension, dyslipidemia, T2DM, and overall LRDs in older Chinese adults. Despite moderate discriminatory ability, WC and BMI remain practical first-line tools for cardiometabolic risk assessment.
Keywords: Waist circumference, body mass index, lifestyle-related diseases, hypertension, dyslipidemia, type 2 diabetes mellitus
Introduction
The complex interplay between lifestyle and health is highly relevant to medical research and public health policy.1 A healthy lifestyle, characterized by balanced nutrition, regular physical activity, abstention from tobacco use, and moderate alcohol consumption, correlates strongly with enhanced well-being and key indicators of healthy aging.2,3 These lifestyle choices are directly linked to the incidence of chronic diseases, notably hypertension, dyslipidemia, and type 2 diabetes mellitus (T2DM).4,5 These conditions are typically classified as lifestyle-related diseases (LRDs) in Asian countries such as Japan.6,7 LRDs not only shorten life expectancy but also diminish the quality of life due to complications such as heart disease, stroke, and kidney failure.8,9 Research shows that more than 80% of residents aged 60 years and older in China have LRDs10. These diseases, when accompanied by abdominal obesity, are components of the metabolic syndrome, a cluster of conditions that significantly heightens the risk of cardiovascular diseases.11
These conditions are interconnected through a combination of genetic and environmental factors, creating substantial public health challenges because of their high prevalence and complex development and progression.12 Lifestyle modifications play a critical role in mitigating risk factors, making early detection and management crucial for preventing serious complications.13 These frequently encountered LRDs profoundly impact both individual lives and the broader healthcare system.14,15 The escalating prevalence of these diseases underscores an urgent need for effective preventive measures. Screening for LRDs is an essential component of preventive healthcare and involves the use of tests or examinations to detect disease in asymptomatic individuals, facilitating early intervention and management.16
Common screening methods for LRDs include blood pressure measurements, blood tests for lipid profiles and blood glucose levels, and anthropometric measures, including waist circumference (WC) and body mass index (BMI).17 However, such anthropometrics have their inherent limitations. BMI is widely used because it is simple and noninvasive, but does not differentiate between fat mass and lean mass. Consequently, individuals with a high muscle mass may be misclassified as overweight or obese, while those with normal BMI but high visceral fat may be incorrectly considered healthy.18 In contrast, WC offers a simple and cost-effective measure that directly reflects abdominal adiposity, a key predictor of hypertension, dyslipidemia, and T2DM.19,20 WC is particularly valuable because visceral fat accumulation is more strongly associated with metabolic risk than overall body size REF. Nevertheless, WC also has disadvantages, such as measurement variability across examiners, its influence by posture or breathing, and a lack of universal cutoff points across different ethnic groups.21 Additionally, there are potentially different cut-off values between Asian and Caucasian populations.22
This study aims to evaluate the associations of WC and BMI with LRDs, including hypertension, dyslipidemia, and T2DM. Given the limitations of each measure, the study further aims to compare their individual discriminatory ability for identifying metabolic risk among older Chinese adults.
Methods
Overview
This retrospective, observational study investigated outpatients who underwent medical checkups at a community hospital in Southeast China from April 2021 to December 2023. The study protocol was approved by the institutional review board of Hangzhou Linping District Hospital of Integrated Traditional Chinese and Western Medicine (approval no. 2024-L-009) and adhered to the provisions of the Declaration of Helsinki, as revised in Brazil in 2013. Informed consent was obtained from all patients through an opt-out option available on the hospital website, as authorized by the institutional review board at the participating facility.
Eligibility
The following were the inclusion criteria: (1) patients aged ≥60 years, (2) patients with recorded WC and BMI, and (3) patients for whom comorbidity data were available. The exclusion criteria were (1) patients with disabilities that made WC or BMI measurement infeasible, (2) patients with insufficient data, and (3) those who declined to provide informed consent.
Definitions
LRDs were defined as conditions in patients with a history of, or a current diagnosis of, hypertension, dyslipidemia, T2DM, or any combination of these disorders. Dyslipidemia was defined as triglycerides ≥150 mg/dL or high-density lipoprotein cholesterol (HDL-C) <40 mg/dL or low-density lipoprotein cholesterol (LDL-C) >140 mg/dL; hypertension as systolic blood pressure ≥130 mmHg or diastolic blood pressure ≥85 mmHg; and diabetes as fasting plasma glucose ≥100 mg/dL or hemoglobin A1c ≥6.5%.17 WC was measured by trained personnel using a nonelastic measuring tape at the midpoint between the lower margin of the last palpable rib and the top of the iliac crest, with participants standing upright. Blood pressure and laboratory measurements were obtained on a single occasion during the routine health check-up.
Outcomes
This study primarily aimed to determine the relationship between WC, BMI, and LRDs. The secondary objectives were to establish WC and BMI cut-off values for identifying the prevalence of hypertension, T2DM, dyslipidemia, and LRDs in Chinese adults aged ≥60 years.
Statistical Analyses
Categorical variables were summarized as counts and percentages, and continuous variables as means with standard deviations (SDs). All statistical tests were conducted using a two-tailed approach, with p-values <0.05 considered statistically significant. The “pROC” and “pheatmap” packages were used to generate heatmaps, construct receiver-operating characteristic (ROC) curves, and calculate the area under the curve (AUC) for all evaluated outcomes. All analyses were performed using R software (version 5.4; R Foundation for Statistical Computing, Vienna, Austria).
Results
Characteristics of Enrolled Patients
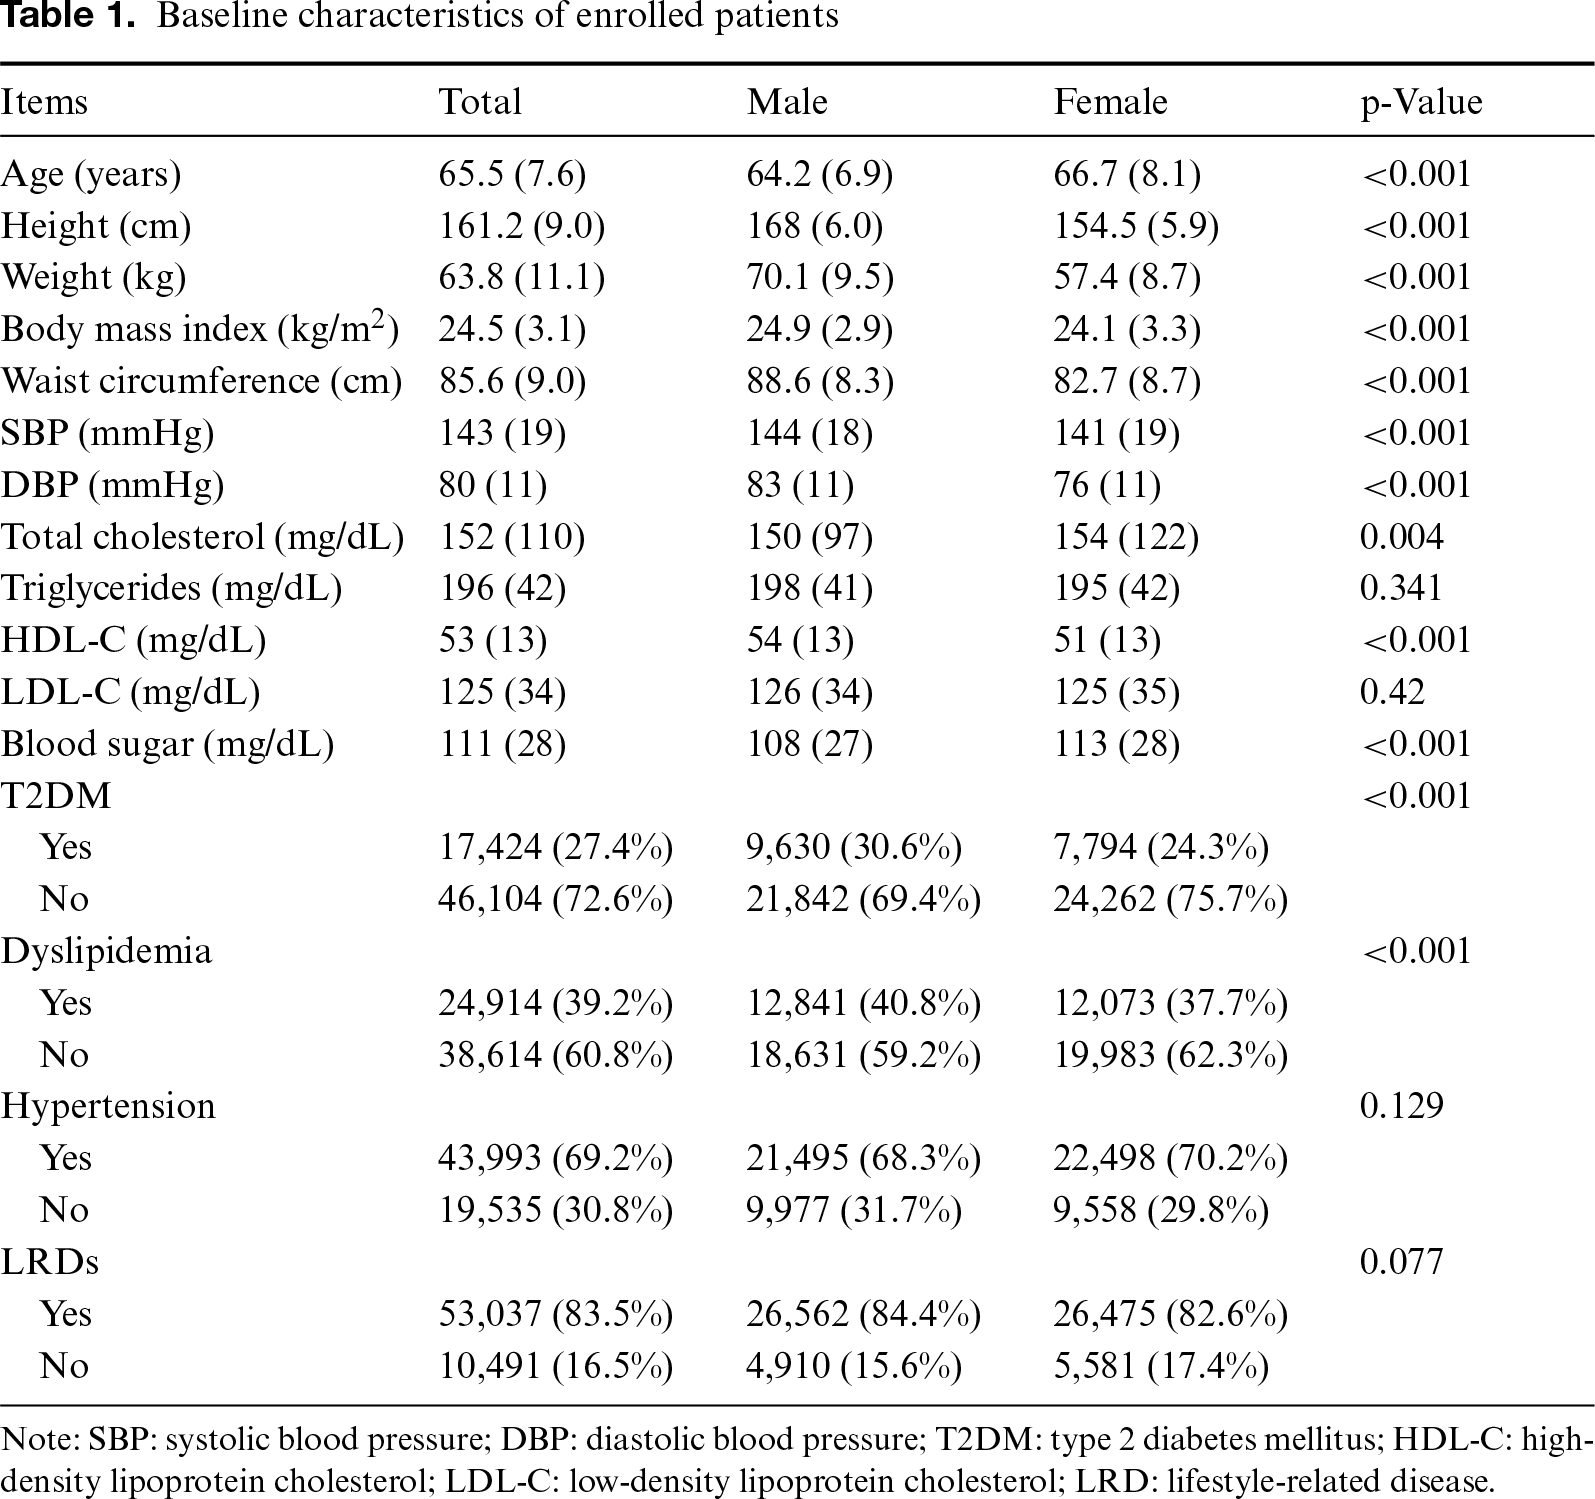
In total, 160,141 records were retrieved. After removing records with missing values, 63,528 individuals (31,472 men and 32,056 women) were included in the final analysis (Table 1). The median age of participants was 65.5 (7.6) years. Statistical analyses revealed significant differences between men and women in age, height, weight, BMI, WC, systolic and diastolic blood pressures, total cholesterol, HDL-C, and blood sugar. However, levels of triglycerides and LDL-C did not indicate any statistically significant differences. The distribution of all enrolled variables, illustrated using violin plots, is shown in Figs. S1–S3. The overall prevalence of T2DM, dyslipidemia, hypertension, and LRDs in the study population was 27.4%, 39.2%, 69.2%, and 83.5%, respectively. Among males versus females, the prevalence of T2DM was 30.6% versus 24.3% (p < 0.001), dyslipidemia 40.8% versus 33.7% (p < 0.001), hypertension 68.3% versus 70.2% (p = 0.129), and LRDs 84.4% versus 82.6% (p = 0.077), respectively.
Relationship between WC or BMI with LRDs
The heatmap between WC and LRDs is presented in Fig. 1. WC was categorized as <80, 80–89, 90–99, and ≥100 cm. As WC increased, the prevalence of T2DM, dyslipidemia, hypertension, and LRDs rose in both sexes. Among individuals with a WC ≥100 cm, the prevalence of T2DM, dyslipidemia, hypertension, and LRDs in males versus females was 35.5% versus 41.9%, 46.4% versus 40.5%, 83.3% versus 89.6%, and 94.2% versus 95.7%, respectively. The heatmap between BMI and LRDs is presented in Fig. 2. BMI was categorized as <18, 18–22.9, 23–27.4, and ≥27.5 kg/m.2 As BMI increased, the prevalence of T2DM, dyslipidemia, hypertension, and LRDs rose in both sexes. Among individuals with a BMI ≥27.5 kg/m2, the prevalence of T2DM, dyslipidemia, hypertension, and LRDs in males versus females was 32.8% versus 33.3%, 50.0% versus 41.5%, 80.1% versus 86.3%, and 92.6% versus 93.0%, respectively.
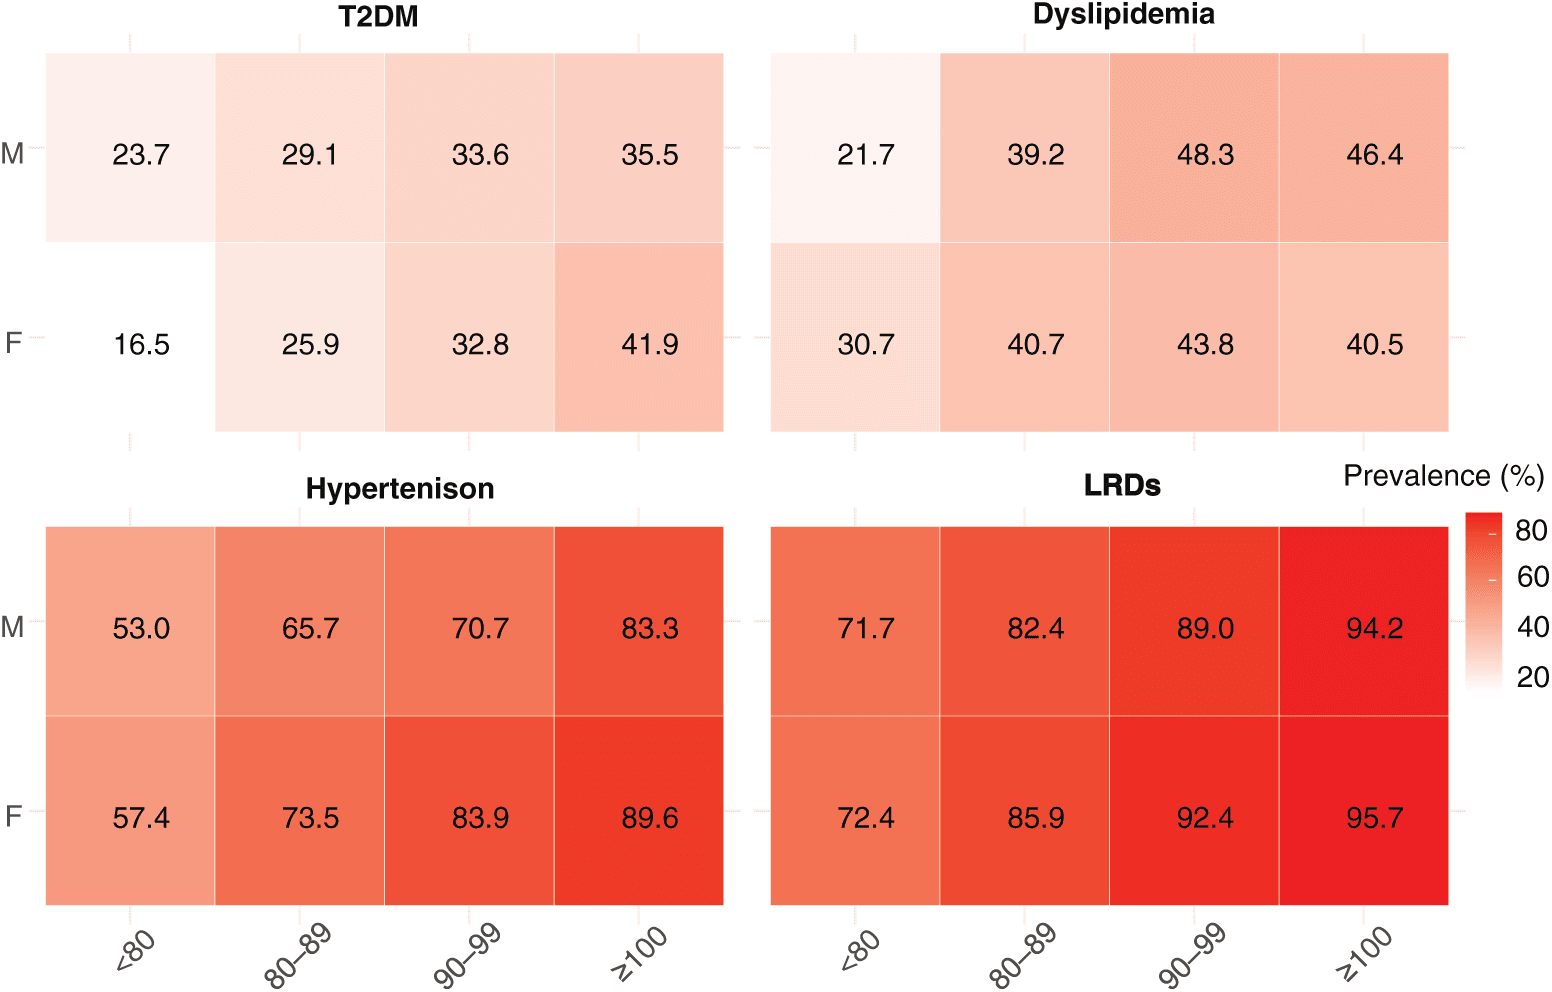
Figure 1. Heatmap of the association between waist circumference and lifestyle-related diseases.
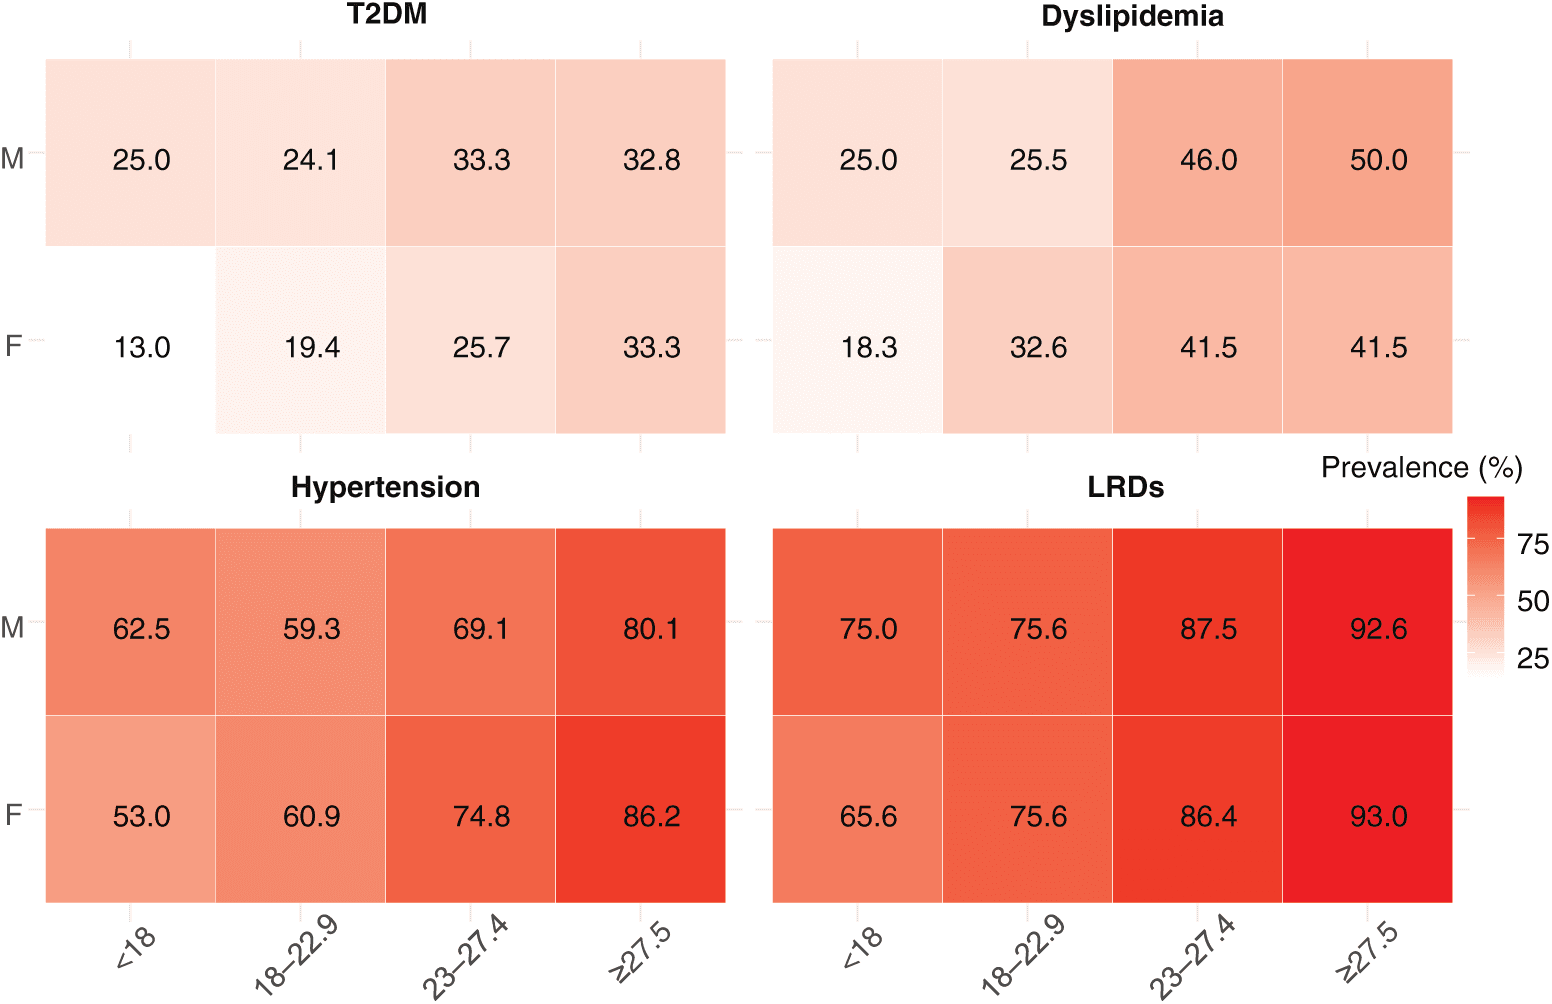
Figure 2. Heatmap of the association between body mass index and lifestyle-related diseases.
Associations of WC and BMI with LRDs
Fig. 3 displays the ROC curves of WC and BMI for predicting LRDs in males and females. The AUCs of WC for all individuals, males, and females were 0.673, 0.660, and 0.674, respectively, with corresponding cut-off values of 83, 87, and 81 cm. The AUCs of BMI for all individuals, males, and females were 0.650, 0.652, and 0.649, respectively, with corresponding cut-off values of 24.0, 24.1, and 23.8 kg/m2. All groups showed statistically significant results, with p-values <0.001.
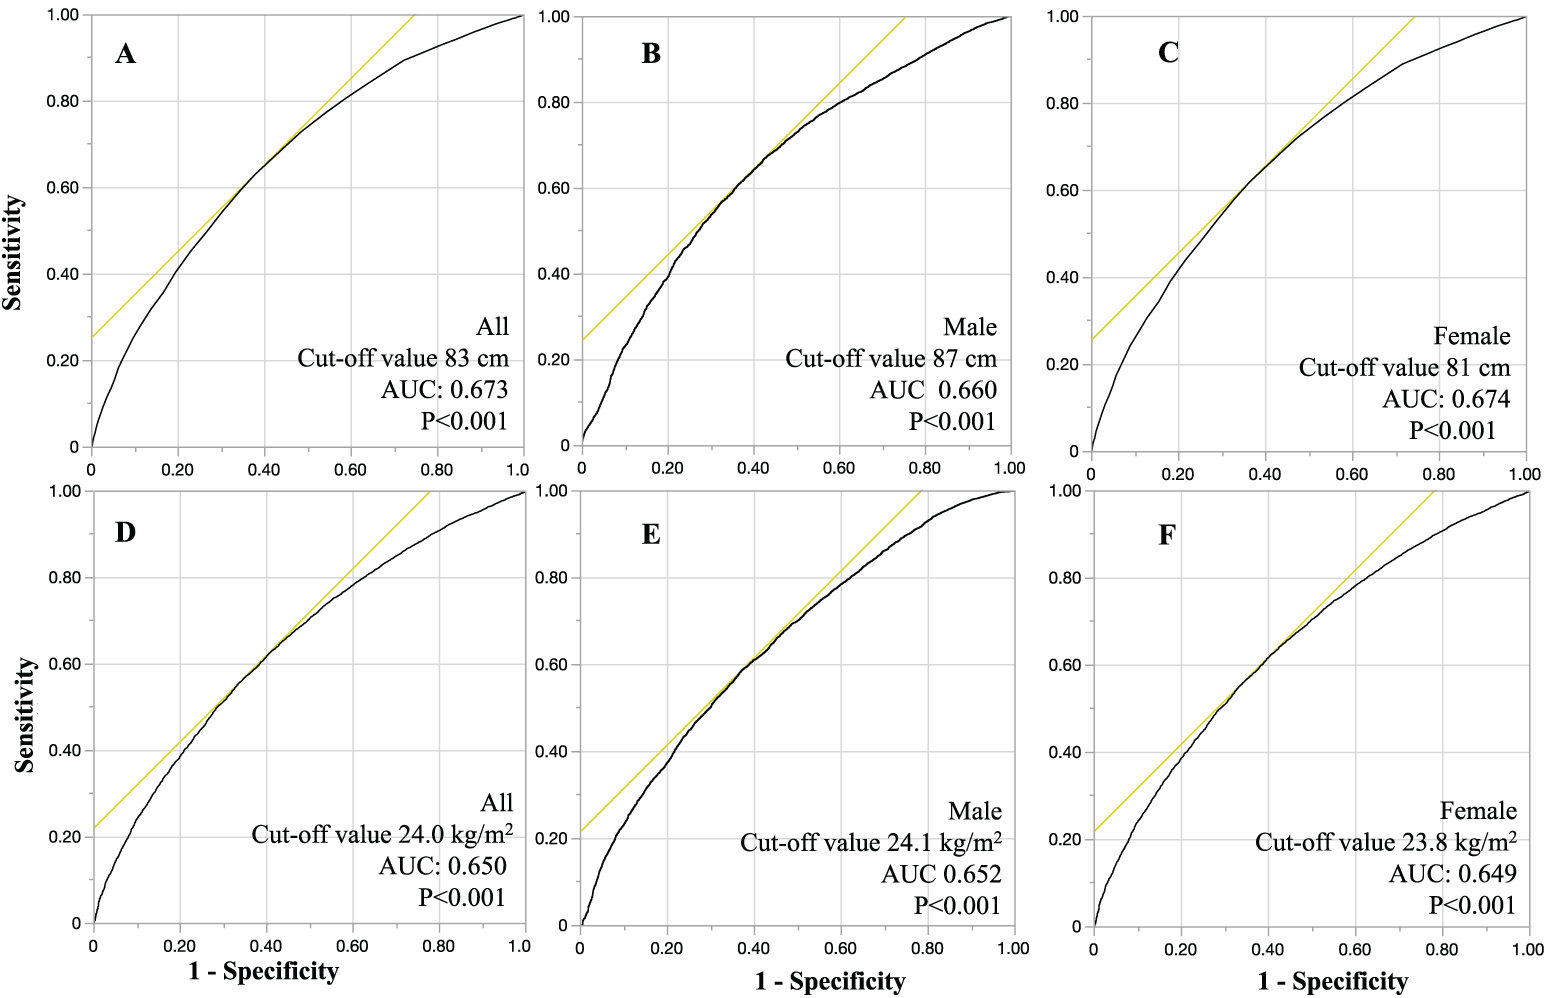
Figure 3. ROC curves for waist circumference and body mass index in predicting lifestyle-related diseases. Panels A, B, and C display the predictive performance of waist circumference for lifestyle-related diseases in all individuals, males, and females, respectively. Panels D, E, and F highlight the predictive performance of body mass index for lifestyle-related diseases in all individuals, males, and females, respectively. ROC: receiver-operating characteristic curves; AUC: area under the curve.
Associations of WC and BMI with Hypertension
Fig. 4 shows the ROC curves of WC and BMI for predicting hypertension in males and females. The AUCs of WC for all individuals, males, and females were 0.650, 0.593, and 0.654, respectively, with corresponding cut-off values of 85, 88, and 81 cm. The AUCs of BMI for all individuals, males, and females were 0.635, 0.601, and 0.637, respectively, with corresponding cut-off values of 23.9, 24.0, and 23.7 kg/m2. All groups showed statistically significant results, with p-values <0.001.
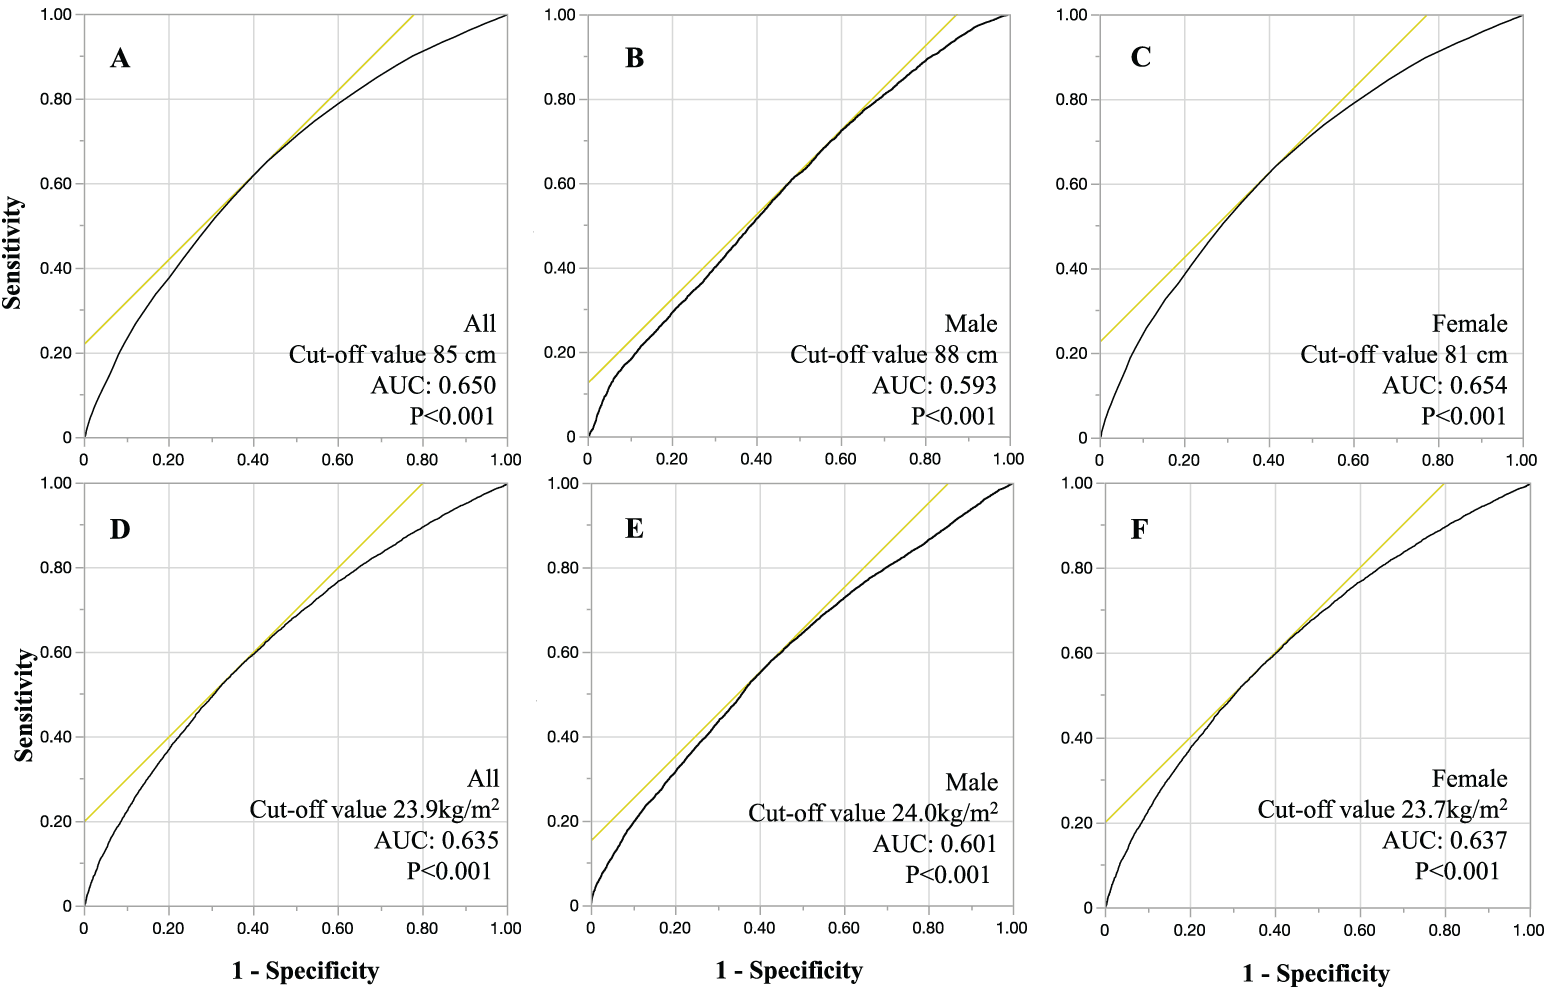
Figure 4. ROC curves for waist circumference and body mass index in predicting hypertension.
Associations of WC and BMI with T2DM
The ROC curves of WC and BMI for predicting T2DM are shown in Fig. S5. The AUCs of WC for all individuals, males, and females were 0.560, 0.556, and 0.563, respectively, with corresponding cut-off values of 88 cm in all groups. The AUCs of BMI for all individuals, males, and females were 0.552, 0.550, and 0.572, respectively, with corresponding cut-off values of 24.7, 23.2, and 25.7 kg/m2. All groups showed statistically significant results, with p-values < 0.001.
Associations of WC and BMI with Dyslipidemia
The ROC curves of WC and BMI for predicting dyslipidemia are shown in Fig. S6. The AUCs of WC for all individuals, males, and females were 0.575, 0.600, and 0.546, respectively, with corresponding cut-off values of 85 cm in all groups. The AUCs of BMI for all individuals, males, and females were 0.585, 0.619, and 0.558, respectively, with corresponding cut-off values of 24.2, 24.2, and 24.7 kg/m2. All groups showed statistically significant results, with p-values <0.001.
Discussion
In this large, population-based study of more than 63,000 adults, we demonstrated clear associations between increasing WC and BMI with a higher prevalence of LRDs, including hypertension, T2DM, and dyslipidemia. The high prevalence of metabolic abnormalities observed in this cohort, particularly in hypertension and LRDs, highlights an urgent need for more effective strategies for cardiometabolic risk detection in aging populations. While the relationship between adiposity and metabolic disease is well established, the present study adds important new evidence by identifying sex-specific WC and BMI cut-off values in a large Asian cohort. These cut-offs are lower than conventional international thresholds, reinforcing observations from previous studies that Asian populations develop metabolic complications at lower levels of adiposity.23–25 Early identification using simple anthropometric measures may therefore facilitate timely lifestyle modification, risk-factor monitoring, and clinical interventions aimed at reducing long-term disease burden.
Both WC and BMI showed clear dose–response relationships with LRDs. Visceral abdominal fat is metabolically active and contributes to insulin resistance, inflammation, and dyslipidemia.26 Increasing WC-defined adiposity was associated with higher prevalence of T2DM, dyslipidemia, hypertension, and overall LRD burden in both sexes, consistent with established mechanisms involving visceral fat accumulation and adiposity-related activation of the renin–angiotensin–aldosterone system.27,28 Notably, the increased prevalence of metabolic diseases at only mildly elevated WC and BMI levels underscores the need to reconsider screening thresholds for Asian populations.29
Consistent sex-related differences were observed across anthropometric and biochemical indicators. Men exhibited higher BMI and a greater prevalence of LRDs, consistent with prior evidence of males accumulating more visceral adipose tissue than females, and androgens promoting central fat deposition.30,31 Visceral adipose tissue is more metabolically active and exhibits higher lipolytic activity, leading to increased release of free fatty acids, hepatic insulin resistance, and secretion of pro-inflammatory cytokines—mechanisms that contribute to the higher metabolic burden observed in men.32,33 Conversely, the predictive value of WC for the prevalence of T2DM and dyslipidemia did not differ significantly between sexes, possibly because WC captures both subcutaneous and visceral compartments and may therefore obscure sex-specific differences in fat distribution.34
Although WC and BMI were statistically significantly associated with LRDs, their discriminatory performance was modest, with AUC values generally around 0.65 for prevalent LRDs and lower for individual metabolic conditions, indicating limited accuracy for individual-level prediction. Nonetheless, in real-world settings such as primary care, routine health checkups, and community-based screening programs, WC and BMI remain practical first-line screening measures due to their simplicity, low cost, and reproducibility. The sex-specific cut-off values identified in this study should therefore be interpreted as pragmatic reference points to identify individuals who may benefit from further metabolic evaluation or early lifestyle intervention, rather than as diagnostic thresholds. Given their modest discriminative ability, WC and BMI should be used in conjunction with other clinical risk factors, and future longitudinal studies incorporating additional metabolic biomarkers and more precise body composition measures may improve risk prediction.
Several limitations in this study should be acknowledged. First, the cross-sectional design precludes causal inference, and residual confounding from unmeasured factors cannot be excluded. Notably, although outcomes were defined as LRDs, no direct data on lifestyle behaviors such as diet, physical activity, smoking, or alcohol consumption were available, limiting our ability to assess their individual contributions. Second, this study was conducted at a single community hospital and included older adults who voluntarily attended routine health check-ups, which may represent a healthier or more health-conscious subset of the older population. This selection may have influenced the observed prevalence of LRDs, potentially leading to underestimation compared with the broader community-dwelling older population. Finally, both WC and BMI cannot differentiate between fat and lean mass or visceral and subcutaneous adiposity, thereby reducing their precision as indicators of metabolic risk.
Conclusion
Higher WC and BMI are significantly associated with increased prevalence of hypertension, T2DM, dyslipidemia, and LRDs. Although their predictive performance is moderate, they remain practical, low-cost tools for early risk stratification. The sex-specific WC and BMI cut-off values identified in this study provide clinically relevant thresholds that may enhance metabolic risk assessment in Asian populations.
Acknowledgment
None.
Funding Statement
None.
Author Contributions
D.L. and S.S. contributed to the conception and design of the study, as well as to data analysis and interpretation. D.L. was involved in data acquisition. G.-Q.L. and S.S. contributed to the revision and critical review of the manuscript. All authors approved the final version of the manuscript, agreed on the journal to which it was submitted, and accept responsibility for all aspects of the work.
Data Availability Statement
The raw data are available upon reasonable request to the corresponding author via email.
Ethics Approval Statement
This study protocol was approved by the institutional review board of Hangzhou Linping District Hospital of Integrated Traditional Chinese and Western Medicine (approval no. 2024-l-009).
Conflict of Interest Disclosure
The authors declare that they have no competing interests.
Supplemental Information
Supplemental information for this article can be found online at https://sup.jclinque.com/api/articles/99/download-suppl.
References
[1] Valentino G, Vio F, Rodriguez-Osiac L. Analysis of the chilean health promotion policy “choose a healthy lifestyle”. Rev Med Chil. February 2023;151(1):42–51. doi:10.4067/s0034-98872023000100042.
[2] Hautekiet P, Saenen ND, Martens DS, et al. A healthy lifestyle is positively associated with mental health and well-being and core markers in ageing. BMC Med. September 29, 2022;20(1):328. doi:10.1186/s12916-022-02524-9.
[3] Santos L. The impact of nutrition and lifestyle modification on health. Eur J Intern Med. March 2022;97(15):18–25. doi:10.1016/j.ejim.2021.09.020.
[4] Fingeret M, Marques-Vidal P, Vollenweider P. Incidence of type 2 diabetes, hypertension, and dyslipidemia in metabolically healthy obese and non-obese. Nutr Metab Cardiovasc Dis. October 2018;28(10):1036–1044. doi:10.1016/j.numecd.2018.06.011.
[5] Kim H, Lim DH, Kim Y. Classification and prediction on the effects of nutritional intake on overweight/obesity, dyslipidemia, hypertension and type 2 diabetes mellitus using deep learning model: 4–7th Korea national health and nutrition examination survey. Int J Environ Res Public Health. May 24, 2021;18(11):5597. doi:10.3390/ijerph18115597.
[6] Yamamoto Y. The role of pediatric screening in preventing lifestyle-related diseases in japan: current practices and future directions. J Atheroscler Thromb. October 1, 2025;1(10):1203–1210. doi:10.5551/jat.RV22040.
[7] Ando T, Miyachi T, Sugano Y, Kamatsuka M, Mishima K, Nomura K. The relationship between insomnia and lifestyle-related diseases among Japanese male truck drivers. Tohoku J Exp Med. September 6, 2023;261(1):1–11. doi:10.1620/tjem.2023.J052.
[8] Alshaya OA, Korayem GB, Alghwainm M, et al. The prevalence of cardiovascular diseases, chronic kidney disease, and obesity in patients with type 2 diabetes mellitus and the description of concurrent treatments: a two-center retrospective cross-sectional study in Saudi Arabia. Saudi Pharm J. May 2024;32(5):102054. doi:10.1016/j.jsps.2024.102054.
[9] Kwakye AO, Kretchy IA, Peprah P, Mensah KB. Factors influencing medication adherence in co-morbid hypertension and diabetes patients: a scoping review. Explor Res Clin Soc Pharm. March 2024;13:100426. doi:10.1016/j.rcsop.2024.100426.
[10] Su B, Li D, Xie J, et al. Chronic disease in china: geographic and socioeconomic determinants among persons aged 60 and older. J American Med Direct Associat. February 01, 2023;24(2):206–212.e5. doi:10.1016/j.jamda.2022.10.002.
[11] Adil SO, Musa KI, Uddin F, et al. Prevalence of undiagnosed metabolic syndrome using three different definitions and identifying associated risk factors among apparently healthy adults in Karachi, Pakistan: a cross-sectional survey in the year 2022. Arch Public Health. February 20, 2024;82(1):22. doi:10.1186/s13690-024-01250-3.
[12] Huang W, Deng S, Liu S, et al. Association of metabolic syndrome and sarcopenia with all-cause and cardiovascular mortality: a prospective cohort study based on the NHANES. Front Endocrinol (Lausanne). 2024;15:1346669. doi:10.3389/fendo.2024.1346669.
[13] Riaz A, Asghar S, Shahid S, Tanvir H, Ejaz MH, Akram M. Prevalence of metabolic syndrome and its risk factors influence on microvascular complications in patients with type 1 and type 2 diabetes mellitus. Cureus. March 2024;16(3):e55478. doi:10.7759/cureus.55478.
[14] Ning F, Sun X, Ge B, et al. Short-term lifestyle education on obesity reduction in adolescents. Front Med (Lausanne). 2024;11:1308190. doi:10.3389/fmed.2024.1308190.
[15] Huang HYR, Badar S, Said M, et al. The advent of RNA-based therapeutics for metabolic syndrome and associated conditions: a comprehensive review of the literature. Mol Biol Rep. April 5, 2024;51(1):493. doi:10.1007/s11033-024-09457-x.
[16] Ma K, Liu H, Guo L, et al. Comparison of metabolic syndrome prevalence and characteristics using five different definitions in China: a population-based retrospective study. Front Public Health. 2024;12:1333910. doi:10.3389/fpubh.2024.1333910.
[17] Alberti KG, Zimmet P, Shaw J. The metabolic syndrome—a new worldwide definition. Lancet. September 24–30, 2005;366(9491):1059–1062. doi:10.1016/s0140-6736(05)67402-8.
[18] Tran TXM, Chang Y, Choi HR, et al. Adiposity, body composition measures, and breast cancer risk in Korean premenopausal women. JAMA Netw Open. April 1, 2024;7(4):e245423. doi:10.1001/jamanetworkopen.2024.5423.
[19] Li S, Wang Y, Ying Y, et al. Independent and joint associations of BMI and waist circumference with the onset of type 2 diabetes mellitus in Chinese adults: prospective data linkage study. JMIR Pub Health Surv. January 11, 2023;9:e39459. doi:10.2196/39459.
[20] Brauer P, Royall D, Li A, et al. Key process features of personalized diet counselling in metabolic syndrome: secondary analysis of feasibility study in primary care. BMC Nutr. May 9, 2022;8(1):45. doi:10.1186/s40795-022-00540-9.
[21] Ross R, Neeland IJ, Yamashita S, et al. Waist circumference as a vital sign in clinical practice: a consensus statement from the IAS and ICCR working group on visceral obesity. Nat Rev Endocrinol. March 01, 2020;16(3):177–189. doi:10.1038/s41574-019-0310-7.
[22] Haam JH, Kim BT, Kim EM, et al. Diagnosis of obesity: 2022 update of clinical practice guidelines for obesity by the Korean society for the study of obesity. J Obes Metab Syndr. June 30, 2023;32(2):121–129. doi:10.7570/jomes23031.
[23] Kuwabara M, Kuwabara R, Niwa K, et al. Different risk for hypertension, diabetes, dyslipidemia, and hyperuricemia according to level of body mass index in Japanese and American subjects. Nutrients. August 3, 2018;10(8):1011. doi:10.3390/nu10081011.
[24] Yamada T, Kimura-Koyanagi M, Sakaguchi K, Ogawa W, Tamori Y. Obesity and risk for its comorbidities diabetes, hypertension, and dyslipidemia in Japanese individuals aged 65 years. Scient Rep. February 09, 2023;13(1):2346. doi:10.1038/s41598-023-29276-7.
[25] Sluyter JD, Plank LD, Rush EC. Identifying metabolic syndrome in migrant Asian Indian adults with anthropometric and visceral fat action points. Diabetol Metabolic Synd. July 15, 2022;14(1):96. doi:10.1186/s13098-022-00871-4.
[26] Trouwborst I, Jardon KM, Gijbels A, et al. Body composition and body fat distribution in tissue-specific insulin resistance and in response to a 12-week isocaloric dietary macronutrient intervention. Nutr Metab (Lond). April 9, 2024;21(1):20. doi:10.1186/s12986-024-00795-y.
[27] Mohammed FA, Baban RS, Jasim MA. Association of uroguanylin, body mass index, and waist circumference: sex differences and obesity implications among a sample of Iraqi Adults in Baghdad city. J Pharm Bioallied Sci. February 2024;16(Suppl 1):S406–S408. doi:10.4103/jpbs.jpbs_632_23.
[28] Nakanishi S, Shimoda M, Kimura T, et al. The impact of handgrip strength and waist circumference on glycemic control: prospective, observational study using outpatient clinical data in Japanese patients with type 2 diabetes mellitus. J Diabetes Investig. March 27, 2024;15(7):892–898. doi:10.1111/jdi.14200.
[29] Wiemann J, Krell-Roesch J, Woll A, Boes K. Longitudinal association between fitness and metabolic syndrome: a population-based study over 29 years follow-up. BMC Pub Health. April 6, 2024;24(1):970. doi:10.1186/s12889-024-18448-3.
[30] Ramirez MF, Pan AS, Parekh JK, et al. Sex Differences in protein biomarkers and measures of fat distribution. J American Heart Associat. 2024;13(22):e000223. doi:10.1161/JAHA.124.000223.
[31] Costa DN, Santosa S, Jensen MD. Sex differences in the metabolism of glucose and fatty acids by adipose tissue and skeletal muscle in humans. Physiol Rev. 2025;105(3):897–934. doi:10.1152/physrev.00008.2024.
[32] Dobre M-Z, Virgolici B, Timnea O. Key roles of brown, subcutaneous, and visceral adipose tissues in obesity and insulin resistance. Current Issues Molec Biol. 2025;47(5):343. doi:10.3390/cimb47050343.
[33] Luo J, Wang Y, Mao J, et al. Features, functions, and associated diseases of visceral and ectopic fat: a comprehensive review. Obesity. May 01, 2025;33(5):825–838. doi:10.1002/oby.24239.
[34] Chagas CL, da Silva NF, Rodrigues IG, et al. Different factors modulate visceral and subcutaneous fat accumulation in adults: a single-center study in Brazil. Front Nutr. 2025;12:1524389. doi:10.3389/fnut.2025.1524389.
 |
Copyright: © 2025 Li et al. This work is licensed under a Creative Commons Attribution 4.0 International License, which permits unrestricted use, distribution, and reproduction in any medium, provided the original work is properly cited. |